
1
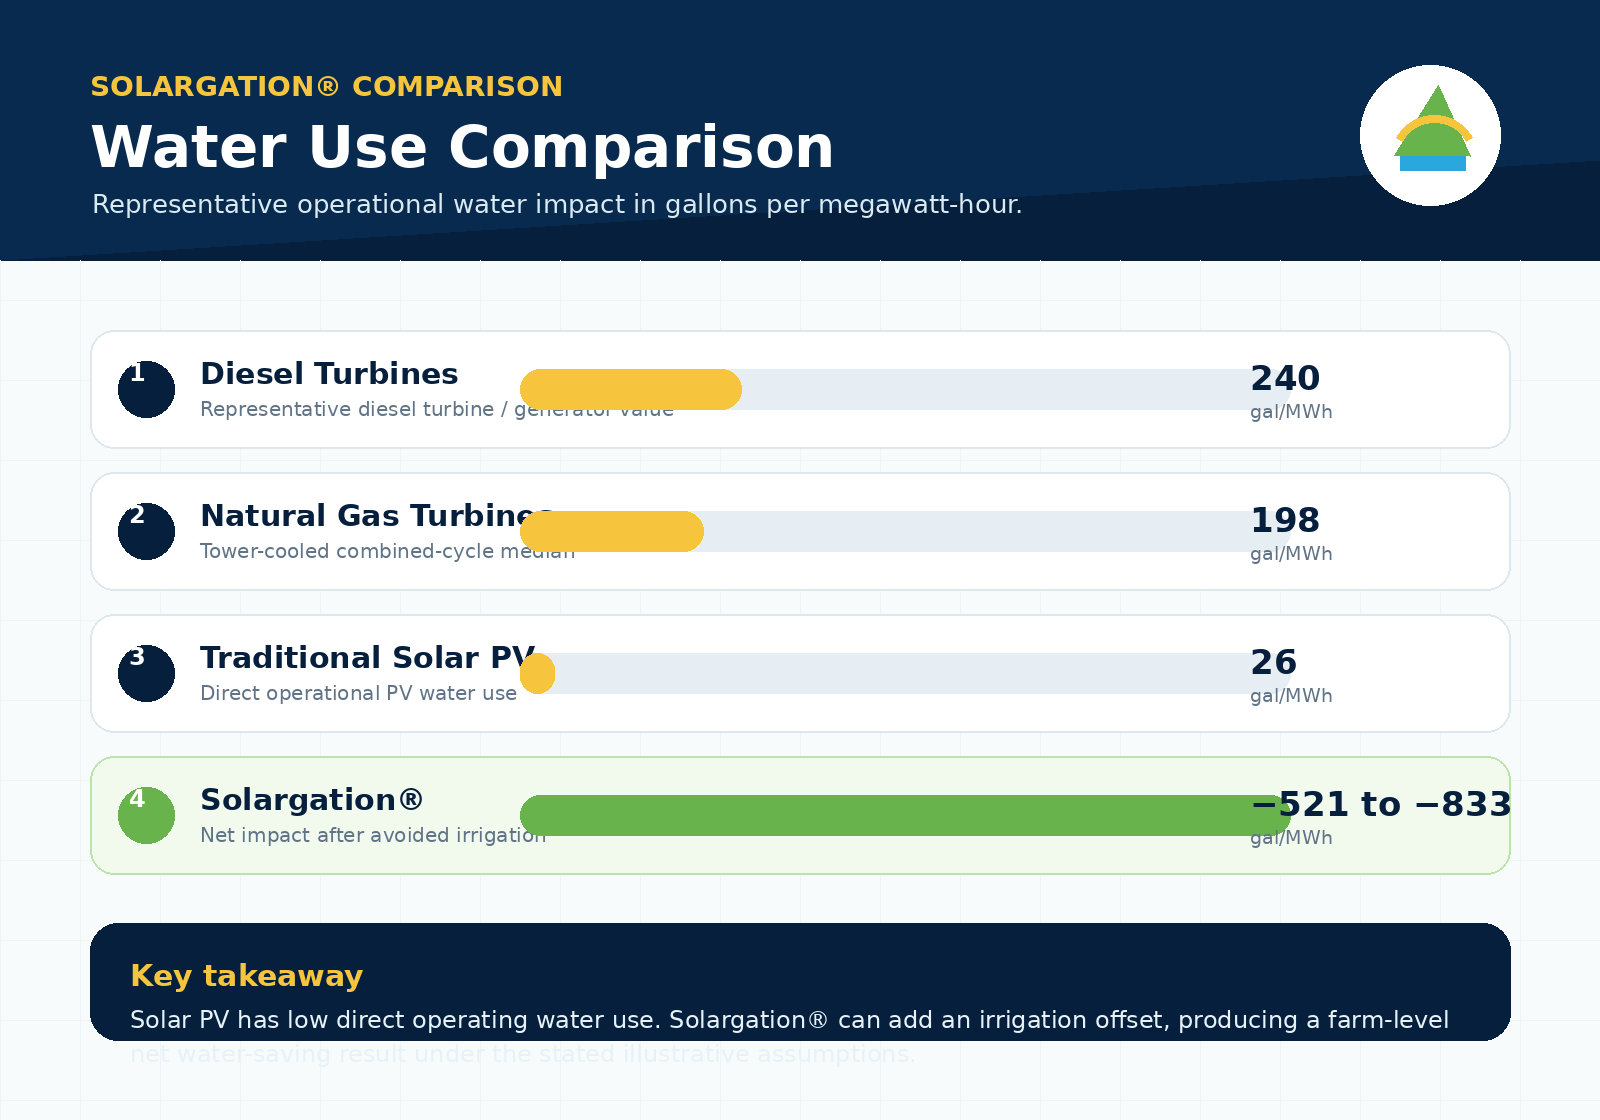
Diesel turbine / generator
Water use: 240 gal/MWh.
Context: representative combustion turbine / diesel value.
-240
gal/MWh
Solargation® results in a significant reduction in agricultural water
Water-use metric shown: gallons per megawatt-hour (gal/MWh) of operational water consumption.
For Solargation®, the page separately highlights direct PV water use , avoided water use , and the resulting net water impact .
The cards below preserve the numbers and framing shown in the water-use infographic, while converting them into a clearer website experience for desktop and mobile viewing.
Water use: 240 gal/MWh.
Context: representative combustion turbine / diesel value.
Water use: -198 gal/MWh.
Context: tower-cooled combined-cycle median.
Water use: 26 gal/MWh.
Context: low operational use because PV does not require cooling water.
Direct PV use: 26 gal/MWh.
Avoided water use: 547–859 gal/MWh.
Net water impact: −521 to −833 gal/MWh, meaning a farm-level net water-saving effect in the illustrative case.
Operational water use only is shown here. Solargation®’s irrigation offset is an illustrative estimate, not a universal value. It depends on crop type, local irrigation demand, climate, and how much irrigation reduction tracks lower soil evaporation.
Solargation® keeps the low direct operating water profile of solar PV, then layers on agricultural water savings by reducing irrigation needs under the provided assumptions. The result can be a net negative water impact on a gallons-per-megawatt-hour basis.
Sources: Macknick et al., NREL (2011) for utility-scale PV median 26 gal/MWh and natural gas combined-cycle tower median 198 gal/MWh; Berkman et al., Brattle Group / WECC (2014) for representative combustion turbine / diesel value 240 gal/MWh; Omer et al., Solar Energy (2022) for cumulative soil-surface evaporation under agrivoltaic systems decreasing by 21%–33%; and conversion assumptions using 7 acres/MW, 2 acre-feet per acre per year, a 20% capacity factor, and 325,851 gallons per acre-foot.
Solargation® creates a unique advantage to the water cycle by dramatically reducing agricultural water consumption while eliminating water consumption from energy resources.
Back to top