
Energy + Agriculture + Economics

Energy cost can move from standard solar economics to a lower LCOE case.

This page converts the provided infographic into a responsive Solargation® energy-cost website, comparing diesel turbines, natural gas turbines, traditional solar PV, and Solargation® PV using U.S. EIA AEO2026 data with an illustrative USDA irrigation-support assumption of 10% for Solargation®.

LCOE framing

The graphic compares levelized cost of electricity in 2025 dollars per MWh.

i

Dataset basis: U.S. EIA AEO2026 data, with the infographic framed around new resources entering service in 2031.

Solargation® adjustment shown: the page preserves the illustrative 10% USDA irrigation-support assumption used to move a starting solar PV LCOE of $58.33/MWh to a Solargation® PV value of $52.50/MWh.

Technology comparison

Solar is materially below peaking turbines on LCOE in this comparison.

The layout below keeps the exact comparison logic of the infographic and adapts it into a clearer web presentation while preserving the Solargation® style system and responsive behavior.

1

Diesel turbine

LCOE: $322/MWh.

Context: illustrative EIA-derived estimate using EIA simple-cycle turbine cost/performance and EIA distillate fuel price assumptions.

$322per MWh
2

Natural gas turbine

LCOE: $172.57/MWh.

Context: EIA AEO2026 combustion turbine value.

$172.57per MWh
3

Traditional solar PV

LCOE: $58.33/MWh.

Context: EIA AEO2026 solar PV value.

$58.33per MWh
4

Solargation® PV

LCOE: $52.50/MWh.

Context: illustrative PV case with a 10% USDA irrigation-support assumption applied to the solar starting point.

$52.50per MWhLowest LCOE
What the comparison means

The infographic positions Solargation® as a lower-cost solar case, not a different thermal resource.

Key takeaway

  • Solar PV is far cheaper than peaking turbines on an LCOE basis in EIA’s 2031 comparison.
  • The diesel estimate is the highest because fuel cost dominates simple-cycle generation economics.
  • Using an illustrative 10% USDA irrigation-support assumption, Solargation® edges below traditional PV on LCOE.

Important note

EIA does not publish a standalone utility-scale diesel turbine LCOE in AEO2026. The diesel value shown here is an illustrative EIA-derived estimate using EIA combustion-turbine cost and performance assumptions together with EIA distillate fuel price data. The Solargation® value is an illustrative incentive-adjusted comparison informed by USDA irrigation-support pathways; USDA programs do not provide a universal flat 10% credit. Direct comparisons also have limits because gas and diesel turbines are dispatchable peakers while solar is a resource-constrained technology.

From standard solar pricing to a lower adjusted solar case.

The infographic’s economic story is that traditional PV already sits far below peaking thermal resources on LCOE, and Solargation® can move modestly lower still when the illustrative irrigation-support framework is applied.

$58.33starting EIA solar PV LCOE per MWh
$52.50illustrative Solargation® PV LCOE per MWh
Sources and methodology

Built directly from the provided energy-cost infographic.

This page keeps the exact values, notes, and methodological framing from the uploaded LCOE infographic and translates them into an editable, responsive HTML5 page using the same visual system as the previous Solargation® web packages.

Sources & methodology listed in the infographic: EIA AEO2026 LCOE report for natural gas combustion turbine at $172.57/MWh and solar PV at $58.33/MWh; EIA AEO2026 methodology showing combustion turbines evaluated at 10% capacity factor; EIA capital cost / performance assumptions including simple-cycle H-class turbine heat rate = 9,142 Btu/kWh, dual-fuel capable; USDA NRCS EQIP providing technical and financial assistance for water conservation and irrigation efficiency; USDA NRCS WaterSMART supporting improved irrigation water-use efficiency; the 10% Solargation® adjustment being an illustrative assumption informed by USDA irrigation-support pathways; and the diesel value being an illustrative EIA-derived estimate rather than a published standalone EIA diesel LCOE.
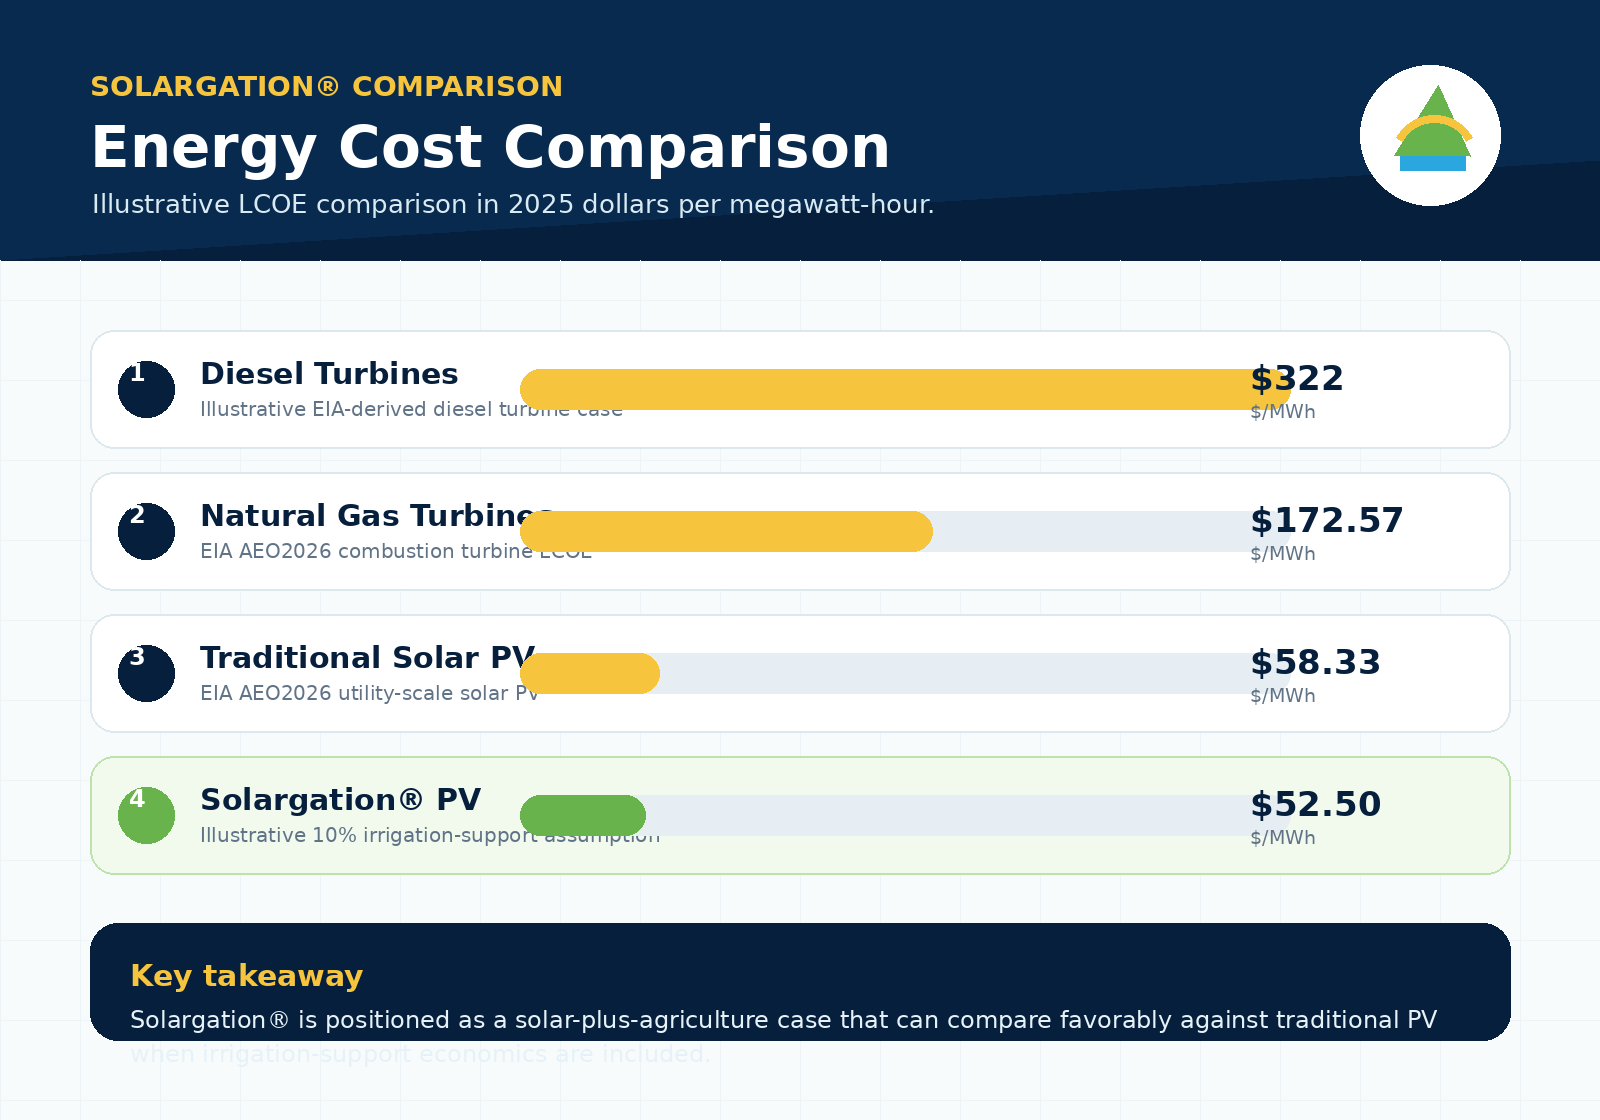
A clean downloadable comparison graphic is included in the website assets for presentation use.

Energy cost comparison graphic
Why Solargation® is lowest in this chart.The infographic starts from the EIA solar PV value and applies an illustrative 10% irrigation-support assumption to show a lower adjusted Solargation® PV LCOE.
Download graphic

Download the energy-cost comparison graphic.

This PNG provides a clean LCOE comparison for diesel turbines, natural gas turbines, traditional solar PV, and Solargation® PV.

Download the energy-cost comparison graphic.
Explore the energy-cost case

A clearer web presentation for the Solargation® LCOE story.

This version keeps the same formatting logic and coding behavior as the prior Solargation® website packages while turning the energy-cost infographic into a practical website page for presentation, editing, and publishing.

Back to top